CHAPTER 2
Layouts
GPS-X layouts contain data on the physical objects being modeled. Among other things, these data include the model(s) being used, physical dimensions, and connectivity between unit processes. The layout defines the structure of your plant model, including the kinds of plant behavior you can model, the degree of flexibility in setting up simulations, the model parameters you can change, and the response variables you can plot.
You can create as many layouts as you wish, with as many different configurations as you would like to model. Layouts and their associated data can be saved for later use, and the information in the layout can be exported for reporting purposes. This information and the layout schematic can be printed or copied to other documents so that you can prepare reports and papers. The layout contains all the information needed to reproduce a session.
Layouts usually correspond to and are prepared from the treatment plant process flow diagram. To prepare a layout of a treatment plant, you will need to know the configuration of the plant, and the unit processes that make up the plant. It is a good idea to refer to your plant diagram as you examine the procedures for building a GPS-X layout.
Opening an Existing Layout
![]() To open a GPS-X layout file, complete the
following steps:
To open a GPS-X layout file, complete the
following steps:
1. Click on the Open button.
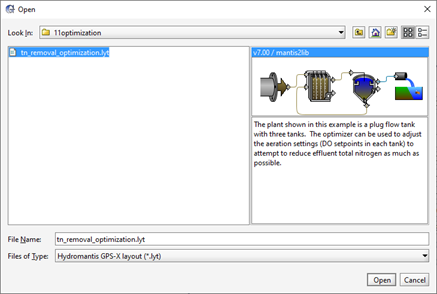
Figure 2‑1 – Open File Browser
2. Use the File Browser to navigate and select the desired GPS-X layout file.
3. Click the Open button. The layout will be opened.
Before opening the model layout, GPS-X checks to see if the current layout has been saved. If the layout has not been saved, a warning dialogue box is displayed which provides the opportunity to save the layout.
If the layout that you are opening contains variables that are not defined in the applicable GPS-X library, a pop-up text form will be displayed that indicates the variables were mapped.
Creating a New Layout
A new layout is started by selecting New from the File menu, or by clicking on the New button on the tool bar.
Saving a Layout
Before getting started on the construction of a layout, it is best to save the layout with a new file name. As you make changes to the layout, you can select Save from the File menu or click on the Save button on the toolbar to update the layout file. If at any time, you want to save the layout to a different file name, select the Save As… item.
To create a new layout, complete the following steps:
1. Open the File menu and select the Save As… item.
2. Use the file browser to navigate to the directory where the file is to be saved.
3. In the File Name text entry field, enter a layout name. Layout names can consist of any alpha-numeric character (among other exclusions, spaces and periods are not allowed). You do not need to append a file extension as one is automatically added to the layout name you enter (.lyt)
4. Click on the Save button. The layout will be saved, and the layout name will be displayed on the main window’s title bar. In general, it is a good idea to save your work often to avoid any loss of information.
GPS-X saves all the information needed to restore your modelling session to the state it was in when you last saved the file. This includes the layout objects and their connectivity, any controls you may have defined and the graphical output you specified. There are several other data files, which are sometimes used with a layout, and in most cases, these are associated with the layout name rather than stored within the layout file. These additional files include raw data files, code additions and output data files. Details on these other files are provided in subsequent chapters.
Selecting and Placing Objects
You are now ready to begin building a model layout. GPS-X allows you to build models graphically by selecting object icons from the objects in the Process Table and placing them on the drawing board. The resulting graphical representation of the plant is later converted to a dynamic model. To be able to select from the objects, you must first display the process table.
To hide/show the process table:
1. Select the View > Toolbars > Process Table menu item. The Process Table window is displayed on the left-hand side of the drawing board. The objects are grouped into collections of like unit processes. Click on the group name (i.e. “Attached Growth Processes”) to open the group.
A distinction is made between object,icon, and model. Object is used to refer in general to a unit process or control point (including the icon and model), icon is used to refer to the picture, and model refers to the underlying mathematical formulae. This distinction is important for understanding the way layout information is stored and how you can tailor GPS-X to include your own icons and models. A complete examination of these topics is given in CHAPTER 11.
Each object has one or more models. You manipulate icons on the drawing board to build a schematic representation of your plant. The icons in the layout are images, which serve as a visual reminder of the type of object being modeled rather than the model itself. Each icon is linked to one or more models, which are manipulated in the preparation of the full plant model.
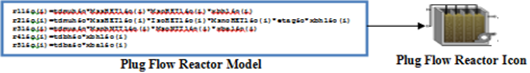
Figure 2‑2 – A Distinction is made between an Object and its Attributes
Once the process table is displayed, you can begin to place objects on the drawing board.
To select an object and place its icon on the drawing board:
1. In the Process Table, left click on any object group.
2. Press and hold the left mouse button on any object icon and drag the object to the drawing board.
3. Release the mouse button. A copy of the object’s icon will be dropped onto the drawing board.
You can continue to drop object icons onto the drawing board by repeating this operation. Notice that the drawing board is divided into equally sized cells. The entire drawing board area is a 32x32 grid. Each of the cells can contain one process icon. Select the Display Grid button on the toolbar to see the gridlines.
Once an icon has been dropped onto the drawing board area, an alternative way to add a new object is to select the object in the drawing board area by clicking and dragging the mouse across the object of interest. This operation shades the selected grid cells a light blue color. Once an area of the drawing board is selected it can be cut, copied, or deleted as required. If the objects were cut or copied, they can be pasted to a different area of the drawing board to create exact copies of the originals (including any attributes you may have changed in the originals). Changing object attributes is discussed in CHAPTER 4.
Connecting Objects
When building a plant layout, you first decide which object(s) to model and then place the appropriate icons on the drawing board as described in the previous section. Having done so, it is necessary to establish the flow paths between process objects. This connectivity is important as it is needed by GPS-X to develop the material balances from which dynamic model equations are prepared.
Icon Connection Points
Each icon has a number of connection points. These points are easily recognized since they are drawn as horizontal or vertical arrows projecting from the icon.
Numbers are assigned automatically to connection points as their labels. Each stream label must be unique to the layout. You can easily change these labels as described in the Labels section of CHAPTER 4.
After the icon is placed on the drawing board, the connection points become active, that is, if you move the mouse pointer over a connection point, the arrow pointer disappears, and a connecting arrow is drawn at the connection point.
As shown in Figure 2‑3, when the mouse pointer is placed over a connection point, a small connecting arrow is displayed (right side of plug flow reactor, connection point 3).
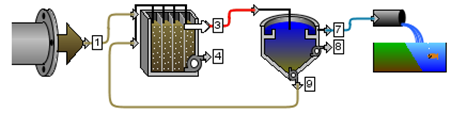
Figure 2‑3 - Model Layout Showing Connection Points. The Reactor Effluent Connection Point is Selected.
Specifying a Flow Path
A flow path is specified by joining the connection points of two objects. To specify a flow path, complete the following steps:
1. Move the mouse pointer to the icon connection point, which you would like to be the flow source. The mouse pointer changes to a connection arrow when it is over an icon connection point.
2. Press the left mouse button and drag a connecting pipe to the icon connection point which you would like to be the flow terminating point. The mouse pointer changes to a connection arrow when it is over an icon connection point.
3. Release the mouse button. With this action, a flow path has been defined.
To delete a flow path, complete the following steps:
1. Move the mouse pointer over the beginning or ending connection point of the flow path you would like to delete. The mouse pointer changes to a connection arrow when it is over an icon connection point.
2. Press the left mouse button and drag a connecting pipe to an empty grid cell.
3. Release the mouse button. You will be prompted to confirm the deletion of the flow path.
To move a flow path, complete the following steps:
1. Move the mouse pointer over the beginning or ending connection point of the flow path you would like to move. The mouse pointer changes to a connection arrow when it is over an icon connection point.
2. Press the left mouse button and drag a connecting pipe to the new destination of the flow path.
3. Release the mouse button
Moving Flow Paths Around
Once a flow path has been correctly drawn on the drawing board, the location of the line connecting the two objects can be moved around to make the diagram clearer and/or less cluttered.
To move an existing flow path while maintaining the connections to the objects, complete the following steps:
1. Place the mouse pointer over the flow path line somewhere between the beginning and ending connection points. The pointer will change to an up/down or left/right arrow, depending on the orientation of the line.
2. Hold the left mouse button while dragging the line to another location.
3. Release the mouse button. This action can be done as many times as required to create as many corners as needed.
Normally, you will want to place the desired object icons on the drawing board and then specify the flow paths. GPS-X contains logic to guide you in selection of appropriate flow paths. For example, GPS-X does not allow flow paths which initiate at an icon input and terminate at an icon output. Similarly, you cannot have flow paths initiating and terminating on the same icon. This logic prevents the creation of incorrect layout diagrams and ensures that a valid model can be prepared. It is not necessary to specify flow paths to every connection point on every icon. For example, in some layouts, one or more objects have zero influent flow, and therefore, do not have any flow path connected to the influent connection point.
Flow Path Color
The color of the flow path is used to quickly convey information about the stream. There are three possible colors that a stream can be: Blue, Brown and Black.
Streams that are colored Blue represent flows of treated water. This includes any streams treated by a tertiary treatment object, streams coming from a clarifier overflow or a water influent.
Streams that are colored Brown are used to represent the flows of wastewater. This includes any clarifier underflow lines, suspended growth effluents and wastewater influents.
Streams that are colored Black are used to represent any streams where the treatment quality of the water cannot immediately be determined from looking at the object. This includes flow combiners, flow splitters and black box objects.
Editing the Layout
At some point in building a plant layout it may become necessary to add or remove object icons and flow paths, either to investigate alternative layouts or correct an existing one.
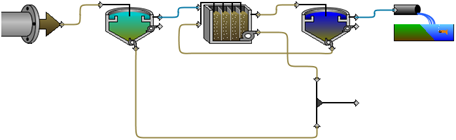
Figure 2‑4 –Layout of a Conventional Activated Sludge Plant
Figure 2‑4 shows the completed layout for a conventional aerobic suspended (activated sludge) treatment process. The layout consists of a single influent, a primary settler, a plug-flow reactor, a secondary clarifier and an effluent outfall structure. Wastage flows from the primary settler and the plug flow reactor are connected in the layout to a combiner object, which consolidates the flows.
Consider the types of editing operations you might want to perform given a layout such as the one in Figure 2‑4. All or part of the layout may be similar to another plant process train that you would like to model, so it would be convenient to copy this portion. If you want to compare layouts with different types of reactor models, you might want to replace the plug-flow reactor with a complete mix reactor. Not all plants waste from the aeration tank, so you may want to delete this flow path. Some plants don’t have a primary settler, or you might want to compare plant performance without one, in which case you would want to delete this unit process icon.
The placement of icons may not be exactly as you would like so you may want to move one or more of the icons. In some cases, it might be necessary to move a flow path, that is, change the initial and/or terminal points. For example, you might want to move the wastage flow path so that wastage occurs from the secondary clarifier rather than the plug flow reactor.
In some cases, editing changes affect the model structure, whereas in other cases, the changes are only cosmetic. For example, replacing a plug flow reactor with a completely mixed reactor significantly changes the plant model, but moving the same reactor to another location on the drawing board (assuming the flow paths are not also changed) does not affect the formulation of the model.
A cosmetic change, which is often useful, is rotation. GPS-X provides facilities for changing the orientation of object icons in order to modify the placement of flow streams. GPS-X uses a special mapping technique to draw the flow paths between object connection points. Rotating an icon can result in improved placement of the flow paths for complex drawings containing many flow paths.
Some editing operations can be done in blocks. This is convenient when making large changes to the layout. GPS-X allows block copy, cut and paste, and block delete. If you have several parallel trains that are identical, you can use the block option to clone a single train and create the remaining trains. Large parts of a layout can be removed by dragging out a region in the block-delete, and you can easily move a large block to a different location using block-cut and paste. These operations are described in detail below.
Selecting One or More Drawing Board Objects
To select a single object:
|
1. Select the object in the drawing board area by clicking the mouse on the object of interest. This operation shades the block on the drawing board containing the object light blue.
|
|
To select a block of objects:
|
1. Select an area of the drawing board by clicking and dragging the mouse across the area of interest. This operation will shade the selected blocks light blue.
|
|
Once an area of the drawing board is selected, the objects within that area can be deleted, copied, or cut and pasted.
Deleting
To delete objects from the selected area of the drawing board:
1. Select an area of the drawing board by clicking and dragging the mouse across the area of interest. This operation shades the blocks containing the selected object(s) light blue.
2. Select Edit > Delete from the main menu or hit the Delete key on your keyboard. A warning message will be displayed for you to verify the delete operation. Selecting Yes causes the object icon and its underlying model to be deleted. If you select No, the object will not be deleted.
Copying and Cutting
|
|
To cut or copy a selected area of the drawing board: |
|
|
1. Select an area of the drawing board by clicking and dragging the mouse across the area of interest. This operation will shade the selected blocks light blue. 2. Click the applicable Cut or Copy button on the toolbar. This operation stores the object data on the local clipboard. |
Pasting
|
|
To paste an object(s) stored on the clipboard: |
|
|
1. Click on the cell of the drawing board where the object(s) is to be pasted. 2. Click the Paste button on the toolbar. The cut or copied object(s) will be pasted to the selected cell. |
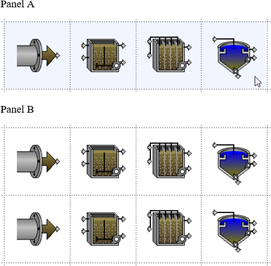
Figure 2‑5 – Performing a Block Copy Operation
Rotating
|
|
Sometimes it may be advantageous to change the orientation of the icon. In some cases, this may be visually necessary to adjust the placement of flow paths. This is often the case with flow combiners and splitters. Connections between objects are maintained when the icon is rotated. |
To rotate an icon:
1. Select the object that is to be rotated.
2. Click the Rotate button on the toolbar. The icon’s orientation will change 90 degrees. Continue clicking the Rotate button until the desired orientation is achieved.
Mirroring
|
|
Yet another cosmetic change that is sometimes needed is mirroring an object icon. To mirror an icon: |
1. Select the object that is to be reversed.
2. Click the Mirror button on the toolbar. The object’s icon will be flipped horizontally.
Zooming and Panning
After placing several objects on the drawing board, you may want to adjust the level of zoom to reduce the amount of whitespace on the drawing board or to focus on specific objects in the plant. This can be done using Zoom to Selection/Plant.
To zoom in on the plant:
|
|
1. Click on the Zoom to Selection/Plant icon. GPS-X will adjust the level of zoom on the drawing board so there is an empty block framing the plant on each side. |
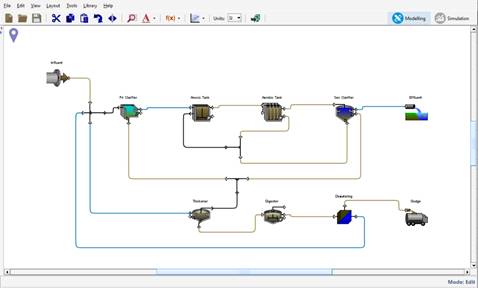
Figure 2‑6 - Zoom to Plant Scaling
To zoom in on objects of interest:
1. Select an area of the drawing board by clicking and dragging the mouse across the area of interest. This operation will shade the selected area light blue.
2. Click on the Zoom to Selection/Plant icon. This will zoom in on the selected area so that it fills the entire drawing board
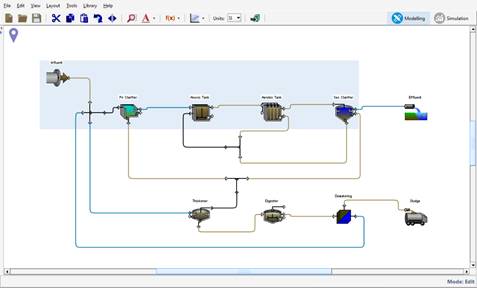
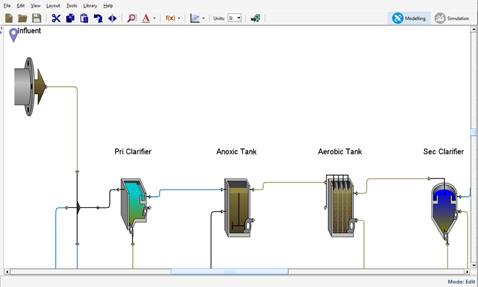
Figure 2‑7 - Zoom to Selection Scaling
Alternatively, if you would like to customize the amount of whitespace being added to the drawing board, you can use the Locator.
The locator window is a viewpoint of the entire drawing board.
To display the locator:
1. Click on the Locator menu item found under View > Zoom. The Locator window is displayed as shown in Figure 2‑8.
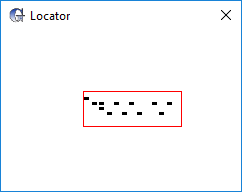
Figure 2‑8 – The Locator Window
A smaller simplified representation of your layout is displayed in the window.
Also, shown in the locator window is a rectangular area, which corresponds to that portion of the total available drawing area currently displayed in drawing board.
To zoom in or out on a portion of the drawing board:
1. Drag out an area on the Locator window. The drag area should correspond to that portion of the total area you would like to view and will be represented by a red rectangle as shown in Figure 2-6. When you drag out a rectangle, the drawing board scale factor changes.
When the drag operation is complete, the drawing board will be updated, showing the selected area. If the selected area is smaller than the previous area, the effect will be to zoom in. Similarly, if the selected area is larger than the previous area, the effect will be to zoom out. If the selected area is offset to one side, the effect is to pan to that side (up, down, right, or left).
Figure 2‑9 shows both the locator and the drawing board at two different scales. The top shows the default scale and the corresponding Locator window. When you drag out a smaller area in the locator window as shown in the bottom half of Figure 2‑9, the scale factor is increased, and the object icons appear larger.
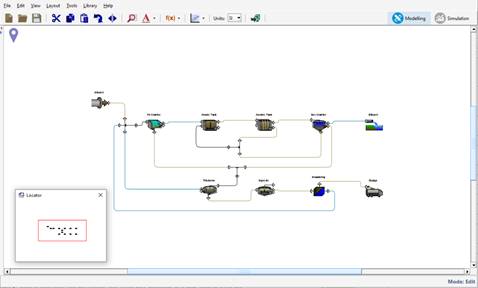
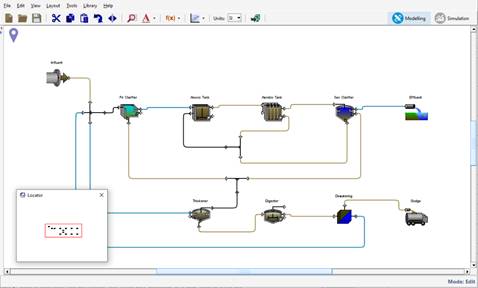
Figure 2‑9 – Locator Window Scaling (2 views)
Layout History Database
The Layout History feature provides a means of storing the state of your layout through each stage of its development. Every time you save your layout, a copy is stored in a database for later retrieval.
To use this feature, select View > Preferences from the main menu bar and then select “Enable layout history” as shown in Figure 2‑10.
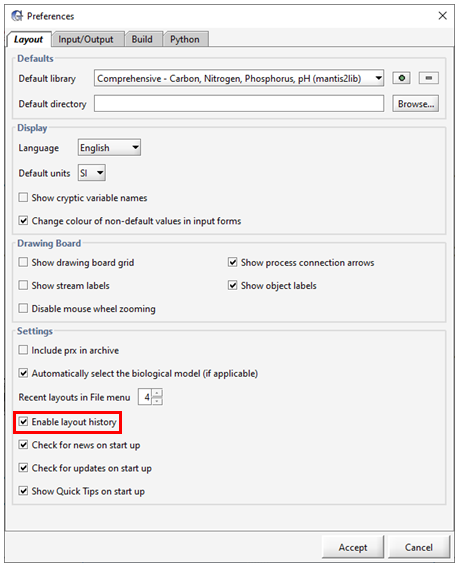
Figure 2‑10 – Enable Layout History
When “Enable layout history” is first selected, a database for storing layouts is created in the user’s login directory. The name of this database directory is: .gpsxhistory. When you select Save or Save As…, your layout will be backed up to the database. Also, any existing layout opened for the first time will be stored in the database.
To access your layout history, select File > History… as shown in Figure 2‑11.
NOTE: This menu item is only accessible in Modelling Mode.
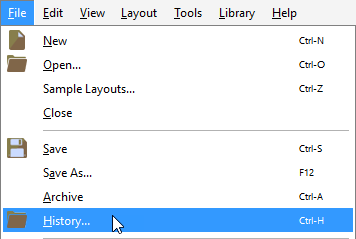
Figure 2‑11 – Accessing the History Option
If your layout is already open in GPS-X you will see a dialog window showing its time stamped history as shown in Figure 2‑12.
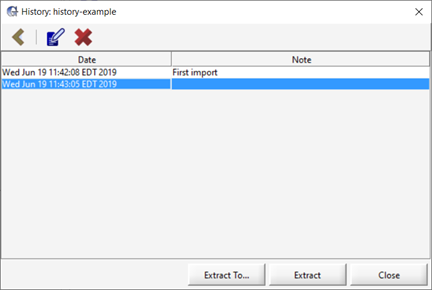
Figure 2‑12 – History Dialog
Several options are presented to you in this dialog window.
(1) You can add a note at each time stamp to describe the layout at that point.
(2) You can select one or more entries to be deleted. By deleting entries that you are not interested in, you will save space on your hard disk and speed up database access.
(3) By selecting the desired time stamp entry and clicking “Extract” you will be asked if you want to overwrite the existing layout (which itself will have been backed up before being overwritten).
(4) Or select “Extract To…” if you want to place the layout in a directory different from the current one.
If no layout is open or you have clicked on “Back to all Layouts” in the dialog window as shown in Figure 2‑12, you will see a different dialog window (see Figure 2‑13) showing a list of all the layouts that have been stored in the database, including the directory paths to the layouts.
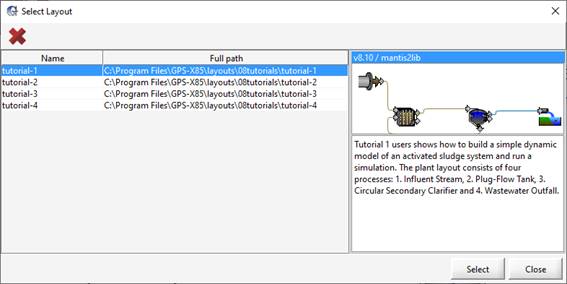
Figure 2‑13 – History Layout Selection Dialog
After selecting one of the layouts and clicking “Select”, you will see the time stamped history dialog window for that layout.
Note that the database does not store any input data files (e.g. .dat or .xls) that you might have. The user is required to back up these files separately.
If you deselect “EnableLayout history” in Preferences, the database is retained and will be available the next time you turn on this feature. You can back up the database directory (<User>/.gpsxhistory) as you would any other directory on your computer. You should deselect “Save Layout History” in the Preferences… dialog first to be sure that the database is not active when doing the back up.
The history database is available to only one instance of GPS-X at a time. When the layout history feature is active, the history feature will remain greyed out in any additional instances of GPS-X that are opened. Consequently, layouts will not be saved to the database from this copy of GPS-X.