Introduction
What is GPS-X?
GPS-X is a software tool that allows for the mathematical modeling, simulation, optimization, and management of water treatment plants. It uses a simple drag and drop interface and comprehensive selection of unit processes to allow for users to simply develop a plant model, enter in characterization data, and run simulations.
Why Create Models of water Treatment Plants?
Models are most commonly implemented to “stand-in” for a real plant process, when testing and analysis on the actual plant is not available or feasible. The five primary reasons are as follows:
1. Allow for the comparison of various designs, process retrofits or operating strategies
2. Verify the capacity of the existing plant
3. Determine process bottlenecks
4. Identify strategies to allow for enhanced cost savings
5. Support regulatory decision making
Objectives
Before moving forward with the tutorials, take a moment to familiarize yourself with the GPS-X interface. This introduction will provide a basic tour of the interface, allowing new users to become more comfortable with the layout, prior to building and running plant model simulations.
Modelling environment
Once GPS-X is opened, observe the basic elements of the GPS-X interface. Make note that you are in Modelling Mode. The button at the top-right of the window can be used to switch between Modelling Mode and Simulation Mode.
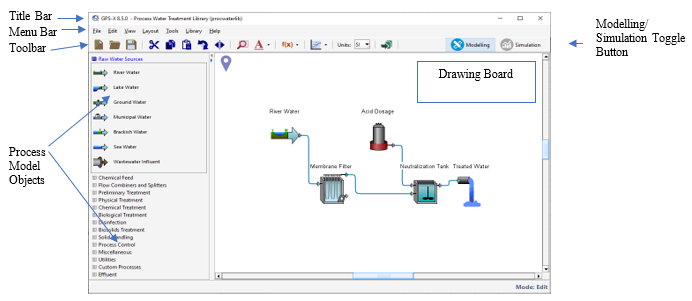
Title Bar
Located here is information regarding the version of GPS-X being used, the name of the model layout being edited, and the library that the layout is using.
Menu Bar
Here there are several menus available:
1. File: Contains items for file handling and manipulation. Additionally, users can access sample layouts, including those for the tutorials, create a zip folder of all files associated with the model layout, and view historical model layouts.
2. Edit: allows users to manipulate objects on the drawing board such as cutting and pasting an object or rotating it.
3. View: allows users to adjust the look of the drawing board and how model objects are being displayed.
4. Layout: allows the user to specify global simulation properties, customized user-code, and common plant-wide properties.
5. Tools: allows access to items relating to the setup and use of a plant model.
6. Library: provides access to a list of available libraries in GPS-X. Please access the Technical Reference Manual for more information.
7. Help: Under Help>Manuals, users can reference 5 documents relating to GPS-X. These should be referred to first when troubleshooting or learning how to use the software. By selecting
Tool Bar
The buttons in this section allow for quick access to particular functions in GPS-X. All of these functions are found in the menus presented in the menu bar.
Process Model Objects
These are the available model objects that can be used to construct the plant models. These are divided into subsections based on their function. For example, under the Suspended Growth Processes header, users can locate objects for a CSTR, plug-flow tank, and/or a membrane bioreactor.
Drawing Board
This large white space is where the model objects are arranged to construct a plant model.
Using the button at the top-right of the screen you can switch into Simulation Mode. Observe the basic elements of the interface.
Simulation Environment
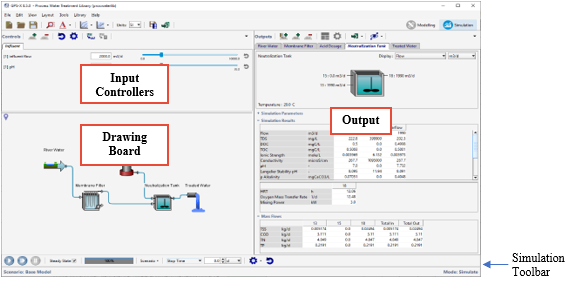
Input Controllers
Here users can create controllers for specific plant properties. For example, shown above are controllers for the influent flow and pH. These allows users to have quick access to variables to be adjusted during a model simulation.
Drawing Board
This space contains a copy of the plant model. Here users can access all of the same menus that are available in Modelling Mode.
Output
This area contains the output graphic displays. Automatically tabs are created for each model object, and users have the opportunity to develop their own custom tables and graphs to display key characteristics of interest.
Once a simulation is run, users have access to buttons to export results, display mass and flow rates on the plant schematic (Sankey and Mass Balance Diagrams) and observe the Energy Usage Summary and Operating Cost Summary information.
Simulation Toolbar
Here users can run the plant simulations. There are Start, Resume, and Pause buttons, and the bar allows for users to see the extent of convergence when the simulation is running. Additionally, within this toolbar, users can create customized scenarios that allow for adjustment of specific model properties.
The subsequent tutorials contained within this manual will provide an in-depth exploration of the GPS-X interface and features available in this software. Tutorials 1 – 5 should be completed if you are new to using GPS-X, while the remaining tutorials cover specific topics that may not be applicable for every user.